
Most embedded firmware bugs don’t show up in a debugger. Thvey show up three months after launch, in the field, when a sensor returns an out-of-range value the firmware never saw during development. Or when a power rail sags 200 mV below nominal and a peripheral fails to initialise. Or when two subsystems fire interrupts within the same microsecond and expose a race condition that never once appeared on the developer’s desk.
The root cause is almost always the same: the firmware was tested in isolation from the hardware it was designed to control. Manual bench testing catches some of these problems, but it doesn’t scale, it isn’t repeatable, and it can’t run at 2 a.m. on a Friday when someone merges a last-minute PR.
A Hardware-in-the-Loop (HIL) test bench solves this but many embedded product teams still treat HIL as either something only automotive OEMs need, or as a prohibitively expensive lab experiment. That perception is outdated, says Zia Ur Rehman, Lead Solutions Architect at Better Devices:
Custom HIL setups built on open frameworks and customized or commercial off-the-shelf hardware cost a fraction of turnkey solutions from dSPACE or National Instruments. That makes HIL accessible even for teams shipping relatively simple products: sensors, gateways, compact controllers. The barrier isn’t budget anymore. It’s knowing where to start.
This guide is where to start. At Better Devices, we design and maintain HIL test infrastructure for clients building industrial IoT gateways, controllers(PLCs), wireless sensor nodes, consumer electronics, and everything in between. Below, our engineering team walks you through the full process vendor-agnostic, practical, and grounded in real project experience.
What Is a HIL Test Bench?
A HIL test bench is a test system that connects a Device Under Test (DUT) , your embedded board running real firmware, to a real-time simulation of its physical environment, allowing automated validation of firmware behaviour under realistic sensor inputs, actuator loads, and communication conditions without deploying to the field.
HIL uses your actual embedded hardware, so it catches silicon-dependent bugs. But the stimulus comes from automated, programmable sources, so it scales like software testing. That combination is what makes HIL the backbone of any serious embedded testing strategy.
From a business perspective, HIL answers one key question: will this device behave correctly under real operating conditions before it reaches production or customer sites?
Why HIL Testing Is a Strategic Asset Not Just a QA Tool
Many teams think of HIL purely as a quality assurance step. Our experience building HIL infrastructure for industrial clients tells a different story.
Defects found after release cost 10–30x more to fix than those caught during development. HIL shifts defect discovery earlier in the cycle, when fixes are cheap and don’t risk certification timelines or customer trust. For any team shipping firmware to production hardware, this alone justifies the investment.
HIL systems simulate expensive physical conditions, reducing the need for costly prototypes, specialised test equipment, and field tests. Zia Ur Rehman, Lead Solutions Architect points to a practical benefit that became especially clear on a recent industrial controller project:
On one engagement, the client was building physical test rigs for every new controller variant, each one taking two weeks and costing thousands in materials. We replaced that with a HIL bench that could simulate the same conditions in software. New variants got validated in hours, not weeks.
Automated HIL results build buyer confidence. For large industrial buyers evaluating your product, showing documented, automated test results against real target hardware signals engineering maturity and lower delivery risk. It moves the conversation from “trust us, we tested it” to “here are the results.”
Once established, a HIL framework scales across product families without rebuilding the test setup from scratch. The same bench architecture wiring patterns, test frameworks, CI/CD integration can be reused and extended as your product line grows.
Core Components of a HIL Test Bench
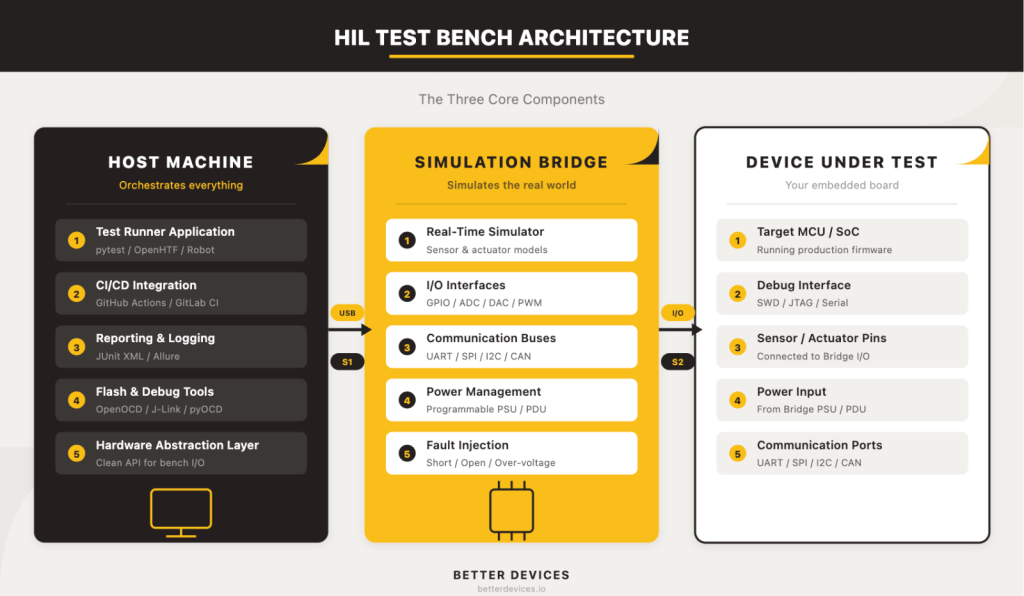
A HIL test bench has three core components. Not seven, not twelve three. Everything else is refinement. Lead Solutions Architect at Better Devices, breaks it down:
Strip away the vendor complexity and every HIL bench has the same skeleton: a host machine that runs the tests, a simulation bridge that generates realistic signals in real time, and the device under test that runs production firmware. Get the relationship between those three right, and the rest is configuration.
1. The Host Machine
The host machine is the brain of the bench. It’s the computer that orchestrates test execution: triggering firmware flashes, commanding the simulation bridge, collecting results, and reporting pass/fail status back to your CI/CD system.
This can be any capable computer, a modest single-board computer for budget setups, or a dedicated rack-mount server for higher throughput. The critical requirement is reliable connectivity to both the simulation bridge and your CI/CD infrastructure whether that’s GitHub Actions (via a self-hosted runner), GitLab CI, or Jenkins.
What runs on the host machine: the Test Runner Application. This is your test orchestration framework pytest with custom hardware fixtures, Robot Framework, or OpenHTF plus the firmware flashing tools (OpenOCD, J-Link Commander, pyOCD) and the reporting pipeline (JUnit XML output for CI/CD dashboards).
What does not run on the host machine: the real-time simulator. This is a critical distinction we’ll address in detail below.
2. The Simulation Bridge
The simulation bridge is the most misunderstood component. It’s the dedicated hardware that generates the signals your DUT expects from the real world sensor inputs, actuator feedback, communication bus traffic, power conditions in real time.
The simulation bridge runs a real-time simulator that must respond to the DUT’s outputs within deterministic timing constraints. If your DUT sends a command and expects a sensor response within microseconds or even nanosecond range, the bridge has to deliver it on time, every time. A general-purpose PC running a test framework and an OS scheduler can’t guarantee that. That’s why the bridge is separate hardware.
The bridge handles: real-time simulation models (sensor and actuator behaviour), I/O interfaces (GPIO, ADC, DAC, PWM), communication buses (UART, SPI, I2C, CAN), power management (programmable PSU, PDU for power cycling), and fault injection (short-to-ground, open circuit, over-voltage on specific signal lines).
On the budget end, a dedicated SBC or microcontroller board with GPIO and DAQ capabilities can serve as the bridge for digital-heavy IoT devices. In the mid-range, commercial DAQ devices from vendors like MCC or Digilent add calibrated analog I/O. At the enterprise end, NI PXI or FPGA-based simulators deliver sub-microsecond timing and thousands of I/O channels.
3. The Device Under Test (DUT)
Your target embedded board or module is the thing you’re trying to validate. It runs real production firmware, and from its perspective, it’s connected to the real physical world. It doesn’t know (and shouldn’t know) that the sensor readings it’s processing come from a simulation bridge rather than a physical sensor.
Before anything else, answer three questions about your DUT: How will you flash firmware onto it programmatically? How will you power-cycle it without human hands? And how will you access its debug interfaces (SWD, JTAG, serial console) from a test script?
If your DUT doesn’t expose these interfaces cleanly, you’ll need to design a breakout board or test jig. Getting this right early saves weeks of frustration later.
How to Put It Together Connection Sequence
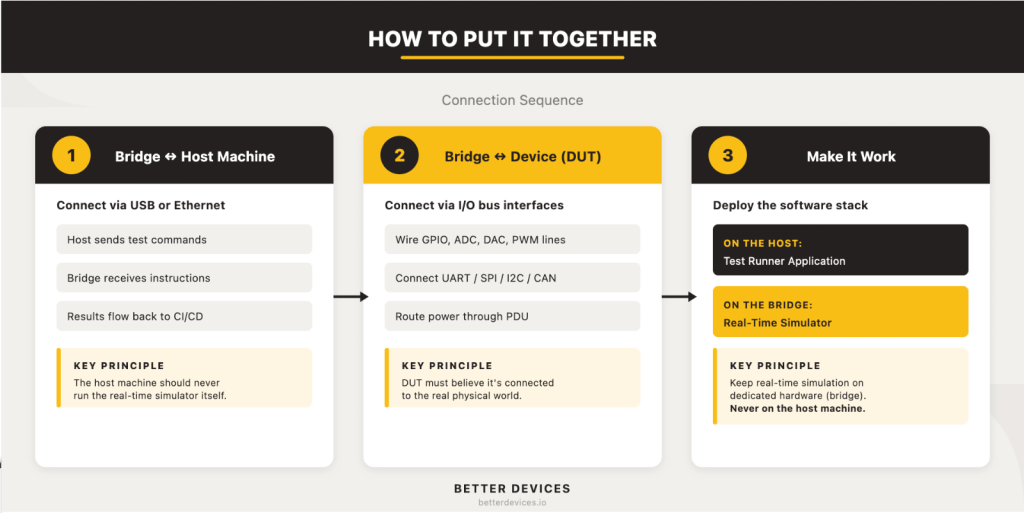
Now that you understand the three components, here’s how they connect. Let’s walk through the physical assembly sequence:
There’s a temptation to wire everything at once. Don’t. Connect the host to the bridge first, verify that the link works, then connect the bridge to the DUT. Two stable connections are much easier to debug than one tangled mess.
Step 1: Connect the Simulation Bridge to the Host Machine
The host machine talks to the simulation bridge over USB, Ethernet, or serial depending on your bridge hardware. This connection carries test commands from the host to the bridge and sensor/actuator data back from the bridge to the host for logging and assertion.
Verify this link independently before touching the DUT. Send commands from the host, confirm the bridge responds correctly, and make sure data flows both directions. If your bridge uses serial, confirm baud rates and flow control. If Ethernet, assign static IPs and isolate the bench on its own network segment so test traffic doesn’t leak into corporate infrastructure.
Step 2: Connect the Simulation Bridge to the Device Under Test
This is the electrical interface that makes the DUT believe it’s operating in its real environment. The specific wiring depends entirely on your DUT’s I/O, but the general pattern is: wire the bridge’s I/O pins to every DUT pin that would normally connect to a sensor, actuator, or external device. This includes GPIO lines, analog inputs and outputs, communication bus connections (UART, SPI, I2C, CAN), and power input (routed through the bridge’s PDU for automated power cycling).
Our Lead Solutions Architect shares a cautionary example from a client engagement:
We inherited a bench where a single misrouted cable had been causing intermittent test failures for six weeks. The client’s engineers had investigated firmware bugs, timing issues, and DAQ calibration drift before anyone thought to trace the wiring. A labelled, documented layout would have caught it in minutes.
Before you solder a single wire, create a complete wiring diagram. Label every cable. Use colour-coding for signal types (power, ground, digital, analog, communication bus). Plan for expansion by leaving spare I/O channels.
Step 3: Deploy the Software Stack
With the hardware connected, the software stack brings the bench to life. This is where the two halves of the HIL software architecture get deployed to their correct homes.
On the host machine: the Test Runner Application. This is your orchestration framework (pytest, Robot Framework, or OpenHTF) configured with a Hardware Abstraction Layer (HAL) that wraps your bridge’s I/O behind a clean API. The HAL is essential; it means your test scripts talk to abstract commands like set_sensor_temperature(25.0) rather than raw GPIO operations. When you change bridge hardware, you update the HAL, and your test scripts don’t change.
Each test case follows the pattern: setup (power on DUT, flash firmware, wait for boot) → stimulus (send commands to bridge, inject signals) → assert (read DUT outputs, check responses) → teardown (power off, reset state).
On the simulation bridge: the Real-Time Simulator. This is the software model of the physical environment your DUT expects to interact with. It runs in a deterministic loop, processing DUT outputs and generating sensor inputs in real time. The model complexity depends on your product for a temperature controller, it might simulate thermal dynamics. For a motor controller, it might simulate motor physics and load conditions.
Better Devices GmbH team emphasises one non-negotiable rule:
Never try to run the real-time simulator on the host machine. It’s a common shortcut, and it always leads to timing jitters, missed simulation deadlines, and tests that pass sometimes and fail others for no apparent reason. The real-time simulator belongs on dedicated hardware. Full stop.
Step 4: Integrate with CI/CD
A HIL bench that isn’t wired into your CI/CD pipeline is a demo rig with extra cables. The entire point is to run hardware-in-the-loop tests automatically on every firmware PR merge, on a nightly schedule, or on-demand before a release.
GitHub Actions with a self-hosted runner is the lowest-friction entry point. Install the runner on your host machine, label it (e.g., hil-bench-01), and add a workflow that targets that label. GitLab CI runners and Jenkins agents work the same way.
Two non-negotiable requirements: tests must be idempotent (running the same test twice produces the same result), and the bench must return to a known-good state after every test run. Power-cycle automation via your PDU handles the hardware side. A robust teardown routine in your test framework handles the software side.
For a deeper dive into the firmware CI/CD side of this, see our guide to building a firmware CI/CD pipeline from scratch.
Common Mistakes When Building a HIL Bench
We’ve built enough HIL infrastructure to recognise the patterns that trip teams up. Three misconceptions come up on nearly every project.
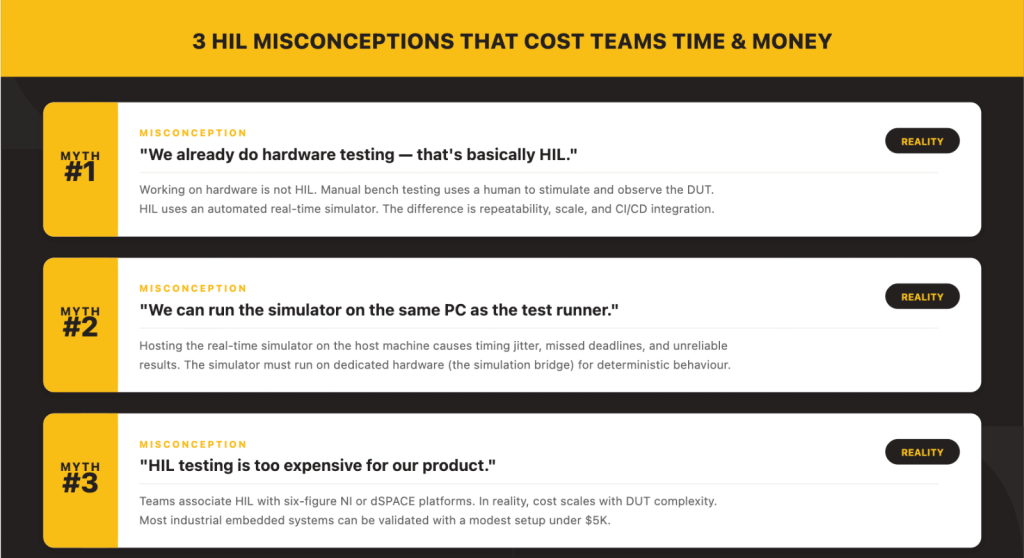
Misconception 1: “We already test on hardware that’s basically HIL.”
This is the most common misunderstanding:
Working on hardware is not HIL. If a human is manually stimulating inputs and reading outputs, that’s bench testing, valuable, but not scalable and not repeatable. HIL means an automated real-time simulator is generating the stimulus. The DUT doesn’t know it’s in a test environment. That’s the distinction that enables CI/CD integration, overnight regression runs, and reproducible results.
Bench testing relies on a person’s judgement and attention. HIL relies on code. That difference is what makes HIL a testing infrastructure asset rather than a one-time debugging activity.
Misconception 2: “We can run the simulator on the same PC as the test runner.”
This shortcut appears in nearly every first attempt at building a HIL bench. It seems logical why buy separate hardware for the simulator when the test runner PC has a spare computer? Let me explain why it fails:
A general-purpose operating system schedules threads, runs garbage collection, handles interrupts for USB devices, and occasionally decides your process can wait 50 milliseconds while it does something else. None of that is acceptable for a real-time simulator that needs to respond within microseconds. The result is timing jitter, missed deadlines, and tests that pass one run and fail the next for no firmware-related reason. Keep the simulator on dedicated hardware.
The fix is straightforward: even a modest dedicated board (an STM32 Discovery, a BeagleBone, or a budget FPGA) running the real-time model gives you deterministic timing that no general-purpose PC can match.
Misconception 3: “HIL is too expensive for our product.”
Teams associate HIL with six-figure NI PXI or dSPACE platforms because those are the most visible players in the space. But we have seen the economics shift:
The cost of a HIL bench is driven by the complexity of the device under test, not by HIL as a concept. If your DUT is a temperature controller, then your test bench cost is driven by the cost of accurately simulating temperature which might be a thermocouple simulator and a $50 DAC. If your DUT is an automotive ECU with 200 I/O channels and ASIL-D certification requirements, then yes, you’re looking at a significant investment. But most industrial embedded products fall somewhere in between, and most can get started with a bench under $1,000.
The perception that HIL is inherently expensive comes from conflating the tool with the problem. A modest product deserves a modest bench and still gets the core benefits: automated testing, CI/CD integration, and reproducible results.
What Does a HIL Test Bench Cost?
Building on the tech lead’s point, cost scales with DUT complexity. Here’s what that looks like in practice.
Budget tier (under $2,000). A Raspberry Pi 4/5 as the host machine, an SBC or dedicated microcontroller as the simulation bridge, relay HATs, USB-to-serial adapters, and an open-source test framework like pytest. Suitable for startups validating one or two boards with primarily digital interfaces temperature sensors, simple gateways, compact controllers. You’ll outgrow it, but it proves the concept fast.
Mid-range ($5,000–$20,000). A dedicated Linux server as the host, a commercial DAQ or FPGA board as the simulation bridge, a programmable power supply (Rigol, Siglent, or Keysight entry-level), a PDU for automated power cycling, and structured cabling. This covers most IoT and industrial embedded products and scales well as you add boards and test cases.
Enterprise ($50,000+). NI PXI, dSPACE, or OPAL-RT platforms with FPGA simulation, high-channel-count I/O, and vendor support contracts. Necessary for automotive, aerospace, and medical device programmes where regulatory compliance demands deterministic, certified test infrastructure.
Here is a reality check:
Hardware is typically the smaller part of the investment. The real cost is engineering time designing the test architecture, writing robust test scripts, debugging the bench during bring-up, and onboarding new team members. Teams that budget only for hardware end up with a bench that works for the person who built it and nobody else.
If you’re trying to estimate total project cost for an IoT product, our IoT Device Cost Calculator can help you model the broader picture including testing infrastructure.
The Value of HIL for Embedded Product Teams
In embedded product development, a HIL test bench is an investment in shipping confidence. It lets manufacturers verify every firmware change before release, prevent regressions across product variants, and maintain consistent behaviour as the codebase grows. Instead of reacting to field failures, teams catch issues early and provide documented proof of quality to customers and partners.
Let’s sum it up:
The teams that invest in HIL early aren’t the ones with the biggest budgets. They’re the ones that got burned by a field failure once and decided it wouldn’t happen again. The bench pays for itself the first time it catches a regression that would have shipped.
Once established, a well-architected HIL framework compounds its value. Tests evolve with the product. The same bench architecture scales across entire device families. CI/CD integration means every firmware merge gets validated against real hardware automatically not when an engineer has time, but every single time.
That’s the shift: from testing when convenient to testing as infrastructure.
What is the difference between SIL and HIL testing?
Software-in-the-Loop (SIL) testing runs firmware or firmware models entirely in software, without any physical hardware. It validates algorithms, logic, and state machines quickly and cheaply. Hardware-in-the-Loop (HIL) testing runs real firmware on real hardware, connected to a simulated environment. HIL catches hardware-dependent bugs, interrupt timing, peripheral behaviour, power-related faults that SIL cannot reproduce. Most embedded teams benefit from using both: SIL for fast inner-loop feedback and HIL for integration-level validation.
Can I build a HIL test bench with a Raspberry Pi?
Yes. A Raspberry Pi 4 or 5 can serve as the host machine, and with relay HATs and USB-to-serial adapters, even as a basic simulation bridge for digital-heavy embedded devices. Combined with a framework like pytest, it’s a viable starting point for teams on a tight budget. You’ll reach its limits when you need calibrated analog I/O, deterministic real-time timing, or multi-DUT testing at which point you add a dedicated simulation bridge and a more powerful host.
How long does it take to set up a HIL test bench?
For a budget-tier bench testing a single board with digital interfaces, a competent embedded engineer can have a working setup in one to two weeks. A mid-range bench with analog I/O, fault injection, and CI/CD integration typically takes four to eight weeks, including test script development. Enterprise setups with certified platforms and hundreds of I/O channels can take three to six months. The most time-consuming part is always writing good test cases, not assembling hardware.
Do I need HIL testing for IoT devices?
If your IoT device runs firmware that interacts with sensors, actuators, or wireless interfaces, HIL testing substantially reduces field failure risk. IoT devices are particularly good candidates for HIL because they often operate in environments where manual testing is impractical (remote deployments, harsh conditions) and firmware updates are expensive to roll back. Even a budget-tier HIL bench running ten critical regression tests on every firmware build provides far more confidence than manual bench testing alone.
What software tools are commonly used for HIL testing?
Common open-source frameworks include OpenHTF (Google’s hardware test framework), Robot Framework, and pytest with custom hardware fixtures. For firmware flashing, OpenOCD, Segger J-Link Commander, and pyOCD are widely used. Reporting typically uses JUnit XML for CI/CD integration, with optional tools like Allure for richer dashboards. On the commercial side, NI TestStand, MATLAB/Simulink, and dSPACE ControlDesk are established platforms, primarily in automotive and aerospace contexts.
Ready to Build?
A HIL test bench isn’t a luxury reserved for automotive OEMs with six-figure testing budgets. It’s the infrastructure that separates teams who ship firmware they hope works from teams who ship firmware they know works.
Start small. Pick your three riskiest firmware paths, the ones that keep your lead engineer up at night and build a bench that validates them on every commit. Match the bench to your DUT’s complexity, not to what the biggest vendor catalogs suggest. Wire it into CI/CD from day one so it stays useful beyond the first sprint.
And if you’d rather not figure all of this out from scratch Better Devices’ QA and Testing team designs, builds, and maintains HIL infrastructure for embedded product teams worldwide. We’ll get your bench running while your engineers stay focused on the firmware. Let’s talk.
Join other engineering leaders receiving our monthly insights, or reach out to discuss how Better Devices can help your team ship faster.